

[UPDATED] Big Data Practical Primer is my notes from Kaiser Fung’s presentation at Big Frontier in which he highlighted his new book, Numbers Rule Your World. Big data is a simple word, but its nuances are critical and require a new way of thinking. This presentation did a good job of covering many high-level definitions and issues of big data & analytics and combined those with some practical how-tos that may surprise you. It can be fairly easy to make serious impact, but, as I suggest in Insights, the biggest barrier to big data is one of imagination and the requirement to think creatively about using data correctly to make business decisions that pay off.
Big Data What
Big Data Definition
- Lots of data: “Big P” is number of variables (or dimensions) and “Big N” number of rules; both explode the amount of data.
- New types of data: unstructured: warranty data, call center logs, streaming events data (person/date/time), (social) network data, contact lists, social networks; Google measures in/out links to rank pages.
- Accessibility of data is unprecedented.
- Moneyball culture uses data for big decisions. Decision making not only intuition as before; Fung doesn’t advocate replacing intuition with data; rather, good data science requires intuition.
Big Data Examples
- CNN online customer acquisition: showed CNN page with TransUnion banners in A/B test; client (TransUnion) focuses on conversion-related data: impressions, ad location on mage, convert rates, Cost Per Action about $8.00. CNN measures sales-related data: placement of ad, advertiser (multiple on most pages), type of ad, revenue, sellthrough, return business, time of day, day of week, location, audience segment.
- Social network sentiment analysis: “positive,” “negative” and sometimes “neutral.” Some have five categories, i.e. “excited” and “horrible.”
- Target knows teen daughter is pregnant before parents. Target data analysis found 25 products corrlated with pregnancy, so it sends direct mail and give coupons related to those products.
- Cisco Social Media Listening Center. Analyze customer twitter and facebook data/feedback and note customer topics in data cloud.
- Yahoo spam filtering (uses big data to flush out spammers). Along these lines, see how Google’s anti-spam analytics process accidentally outed Chinese car thief gang.
- Volunteerism dashboard shows volunteerism rates by state, by year and correlates to natural disasters.
Big Data How
Data: Where
- You already have it, it’s everywhere: transaction data, Web cookies, email response data, social media behavioral data, “appends” (data you buy), call center data, forms people fill out… You need to collect it to use it.
- Open data is huge and growing. Data.gov is one example (state, county, census, city, jobs data, traffic fatalities, restaurant inspections. Another data-rich site that constantly pops up in client engagements is City-Data.
- MIY (make it yourself, of course ;^): Web source traffic, search traffic, conversion rates. A lot of programming goes into Web ads/calls to action, another CNN example; surveys, email responses, webscraping. PandaExpress example: answer 3 questions for free entree is all data collection, has dedicated URL; this isn’t hard, you can use free survey tools like Survey Monkey; after survey completion, the customer gets a code, a unique identifier that s/he writes on the paper receipt and redeems at retail (like Starbucks, Dominick’s, Panera, Corner Bakery…). MIY sometimes better because it’s designed around your business goals.
Data: Tools
Spreadsheets, database, Web services, Web utilities.
Data: People, Three Musts + Two Wants
Things Fung looks for when hiring data scientists/analysts to create teams. Big data requires a new way of thinking.
- Math and statistics background.
- The ability to “think business.”
- “Number sense,” intuition, [creativity] to find patterns in data.
- The ability to code (program).
- Presentation skills.
Big Data Teams
-

- Too many firms focus on tech [Click to enlarge]
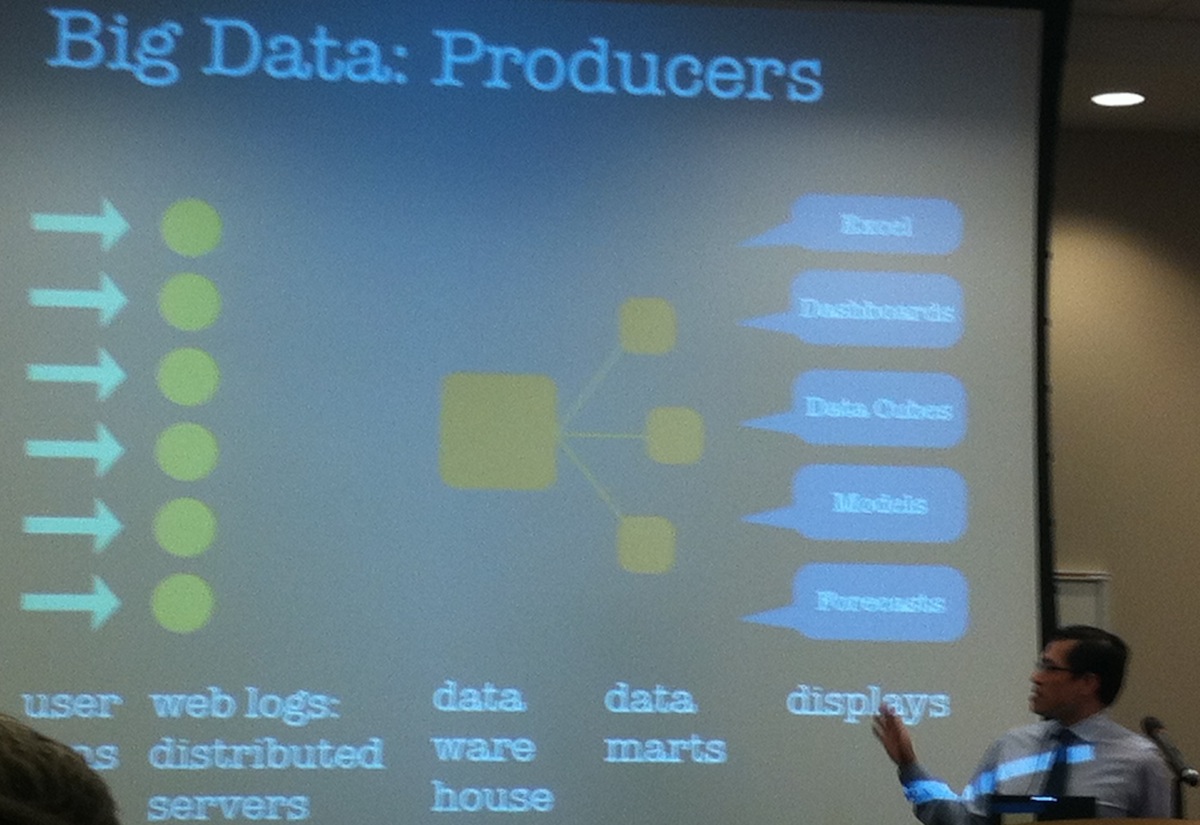
-
- Opportunity lies in using data strategically [Click to enlarge]

-

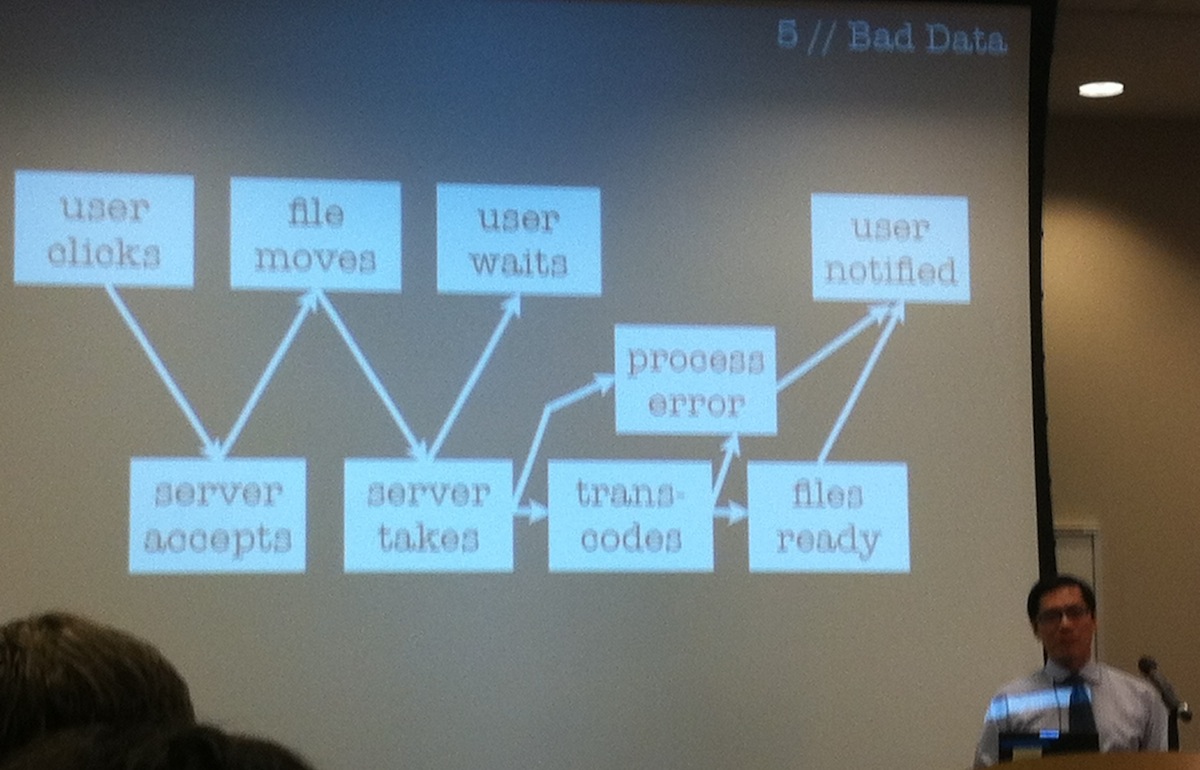
- Deconstructing bad data [Click to enlarge]
- Too many firms focus on the front end of the left side of the slide (“Producers”), but the real value add is on the right side (“Consumers”): strategies, tactics and plans; it’s focused on practical action.
- A big issue is how to scale down massive amounts of data.
Data: Tips on Getting Started
- Start small; example with his own blog, Junk Charts. On the blog, he asked readers to answer three simple usability questions for a chance to win a free book. He was surprised that 20% failed to get all three right, so were the questions too hard or were the people not reading/guessing? He tested with SurveyMonkey, found high correlation between the 20% and the least amount of time spent on the SM survey (the 80% spent significantly longer to complete the SM survey).
- You must invest (big data not a quick endeavor); Netflix prize to beat its Cinematch; diminishing returns, the simplest (most coarse) data usually has the biggest impact. Winner BellKor’s Pragmatic Chaos team produced 10% better than Cinematch, but other contestants were close.
- Think long run. Email opens is an example to show why. A line chart showed a marked dip in opens in June, but if you have data from other years, you note June dips in all years; history gives context. Network data helps; the more Facebook friends you have, the better Facebook can make recommendations (it has more data on your social graph). So don’t quit before the fruit ripens.
- Don’t be “data-driven,” be “results-driven.”
- Cisco example, their (response) strategy is based on network data.
- Showed Harrah’s casino flowchart, takes data at various checkpoints in a workstream, so each checkpoint generates data and they can measure the workstream.
- Target: they use data for customer acquisition, but most of their 25 metrics can only be measured on existing customers, so it’s more about customer retention. They know that pregnancy is a life-changing event, so people are far more likely to change their permanent shopping habits. Therefore, Target wants to retain existing customers and acquire new ones. They offer promotions to existing customers.
- Bad data is worse than no data, and it’s hard to detect. Example of data table with three columns: date/time, user ID and “upload video” data. One day it went all haywire. Had to deconstruct the user workstream and checkpoints to find where the deviation was happening. Besides, what precise user action populated the “upload video”? (see slide above)
- Keep it simple. Quick audience poll asked us to predict, within a sample of 100 study participants, 30 were engineers and 70 attorneys. Gave a bio description of one participant, a 45 year old man, his hobbies, political interests, family. Then multiple choice, the probability that the sample was an engineer. a) 10-40%, b) 40-60%, c) 60-80%, d) 80-100%. Answer a), not because of any of the bio, but because you knew 30 were engineers. This showed that it’s too easy to get distracted by extraneous details like the bio.
Big Data Privacy Problems
- “Dollar on the sidewalk” mentality by firms. They think, well, it’s there, use it.
- “Because it’s free” syndrome. Social networks, because they provide a free service (Facebook, Twitter), often feel little compunction to safeguard privacy.
- “Forced consent.” So many websites force the user to agree to terms before they can even interact with the website (and virtually none read the consent form or understand it).
- “Left hand, right hand problem.” The marketers in the firm make privacy promises to users, but the data scientists are rarely informed about it, so they use the data in ways the firm has promised they won’t. Example, telecoms promise they aren’t using location data.
- We need strong self-regulation, or the government will step in.
Insights
- Based on my due diligence for the Big Data & Analytics Competency Center, I think the biggest barrier to big data is one of creativity and imagination. Data have no “intelligence,” and more isn’t better. As Fung remarked under “People,” big data requires a mix of numerically-based analytical aptitude or knowledge, combined with creativity to assemble, configure and deliver the data, so it’s actionable to users.
- Note in the volunteerism example the mashing up of traditional “data” (volunteerism by state by year) with “external” public data like natural disasters. That is a hallmark of big data, using different kinds of data together. As Fung stated (without using these words), creativity and an analytical, logical mind are what’s required to excel. Traditional analytics only uses firm data and is very structured in approach, process and thinking.
- Big data is a huge opportunity because it is more externally focused, and the external environment is far more dynamic that internal. Big data can be fast and agile once teams, processes and tools are organized, which is not trivial.
- Optimize big data investments by using simplicity. Using simple data can increase the probability that a decision is the right one. The above example under “Keep it simple” is illustrative.
- One challenge Fung didn’t mention was that people in general don’t understand probability well, and big data acts on probability. People generally want to predict with certainty the one and only outcome of a situation, but big data actually tells you about the probability of an outcome. This is emotionally unsatisfying to most people, so big data data can be challenging to wrap one’s mind around. I wrote about this in more detail in my Everything Is Obvious review (sections six and seven).
- Another nugget I want to reemphasize is diminishing returns that Fung highlighted under Keep it simple. A more detailed example is in the Everything is Obvious review, section seven. Same conclusion, simple constructs (i.e. 30/100 of the sample were engineers) improve probability a lot.
- In the Big Data & Analytics Competency Center, I suggest that, since big data investments are very costly and long, an effective means to develop hypotheses (for “what if we could gather and correlate and use X type of data on Y people doing Z activities”) and test them is using social business to listen to Y users in social venues and present X and Z data to users to see how they respond. Of course, this social data becomes another highly qualified case of MIY data. I asked Fung about it during Q&A, and he said similar things were already happening and pointed to the Cisco example, which has a workstream and tests hypotheses using surveys.
- Kaiser’s blog, Junk Charts, is a great place to drill down.
[…] recently covered Kaiser’s talk when he presented key concepts from his books on big […]
[…] who revels in thinking about information in creative ways. He’s curious and smart. I covered his Chicago talk, and he’s like that in person, too, one of those people who thrives on what he’s doing. […]
[…] post Big Data Practical Primer: Junk Charts’ Kaiser Fung appeared first on Christopher S. Rollyson and […]